file 加载程序
(gdb) file bomb
Reading symbols from bomb...
set args 带参数调试
有时候程序不是直接可以运行的,需要加上一些必要的参数。带上参数运行很容易,只要在程序名后加上相应参数即可,但是如何带上参数进行调试呢?这就需要set args命令。
比如在BombLab实验中,我们不可能一次解决所有phase,但是每次重新调试,已经解决的phase还要重新输入一次答案,这就很麻烦,好在这个实验的作者也考虑到了,他支持读取文本。我们可以把答案预先写入一个文本文件中,程序读取已经保存的答案即可跳过相应的phase。
假设我们把答案写入了solutions.txt文件中,首先,我们加载程序,然后通过set args solutions.txt设置运行参数。
(gdb) file bomb
Reading symbols from bomb...
(gdb) set args solutions.txt
(gdb) r
Starting program: /home/dominic/learning-linux/bomb/bomb solutions.txt
Welcome to my fiendish little bomb. You have 6 phases with
which to blow yourself up. Have a nice day!
Phase 1 defused. How about the next one?
That's number 2.  Keep going!
list 查看源码
查看 10 行源码
每条命令显示 10 行代码
(gdb) l
23 #include <stdio.h>
24 #include <stdlib.h>
25 #include "support.h"
26 #include "phases.h"
27
28 /*
29  * Note to self: Remember to erase this file so my victims will have no
30  * idea what is going on, and so they will all blow up in a
31  * spectaculary fiendish explosion. -- Dr. Evil
32  */
(gdb) l
33
34 FILE *infile;
35
36 int main(int argc, char *argv[])
37 {
38     char *input;
39
40     /* Note to self: remember to port this bomb to Windows and put a
41      * fantastic GUI on it. */
42
set list num 设置默认显示代码行数
(gdb) set list 20 //默认显示20行代码list linenumber 查看指定行代码
(gdb) l 10
(gdb) l main.h : 10 //指定main.c文件中的第十行
list function 查看指定函数的代码
break 打断点
break linenum 对指定行打断点
(gdb) b 36
Note: breakpoint 1 also set at pc 0x400da0.
Breakpoint 2 at 0x400da0: file bomb.c, line 37.
break function 对指定函数打断点
(gdb) b main
Breakpoint 3 at 0x400da0: file bomb.c, line 37.
(gdb) b phase_1
Breakpoint 4 at 0x400ee0
删除断点包括禁用断点
delete 删除所有断点
(gdb) delete
Delete all breakpoints? (y or n) y
disable breakpoint 禁用断点
(gdb) info b #先看有哪些断点
Num     Type           Disp Enb Address            What
3       breakpoint     keep y   0x0000000000400da0 in main at bomb.c:37
4       breakpoint     keep y   0x0000000000400ee0 <phase_1>
(gdb) d 3 #禁用第三号断点
(gdb) info b #再次查看断点信息发现已经没有第三号断点
Num     Type           Disp Enb Address            What
4       breakpoint     keep y   0x0000000000400ee0 <phase_1>
clear function 删除一个函数中所有的断点
(gdb) info b
Num     Type           Disp Enb Address            What
4       breakpoint     keep y   0x0000000000400ee0 <phase_1>
(gdb) clear phase_1
(gdb) info b
Deleted breakpoint 4 No breakpoints or watchpoints.
启动与退出
run 启动程序直到遇到断点
(gdb) run start 启动程序并在第一条代码处停下
(gdb) startx 配置 gdb 常用命令
gdb -q -x gdbinit//gdbinit
display/z $xs
display/z $x6
display/z $x7
set disassemble-next-line on
b _start
target remote: 34有了配置文件,就不用每次启动 gdb 时都要重新输入一遍调试命令。
quit 退出调试
(gdb) quit调试命令
print 打印变量值
| 格式化字符 (/fmt) | 说明 |
|---|---|
| /x | 以十六进制的形式打印出整数。 |
| /d | 以有符号、十进制的形式打印出整数。 |
| /u | 以无符号、十进制的形式打印出整数。 |
| /o | 以八进制的形式打印出整数。 |
| /t | 以二进制的形式打印出整数。 |
| /f | 以浮点数的形式打印变量或表达式的值。 |
| /c | 以字符形式打印变量或表达式的值。 |
(gdb) p i       # 10进制
$5 = 3
(gdb) p/x i     # 16进制
$6 = 0x3
(gdb) p/o i     # 8进制
$7 = 03
打印地址值
表示从内存地址 0x54320 读取内容,h 表示以双字节为单位,3 表示输出 3 个单位,u 表示按照十六进制显示。
(gdb) x/3uh 0x54320 查看当前程序栈的内容:x/10x $sp–>打印 stack 的前 10 个元素
查看当前程序栈的信息:info frame—-list general info about the frame
查看当前程序栈的参数:info args—lists arguments to the function
查看当前程序栈的局部变量:info locals—list variables stored in the frame
查看当前寄存器的值:info registers(不包括浮点寄存器)
ptype 打印变量类型
(gdb) ptype i
type = int
(gdb) ptype array[i]
type = int
(gdb) ptype array
type = int [12]
display 跟踪显示变量
print命令可以打印出变量的值,但是只是一次性的。如果我们想要跟踪某个变量的变化,可以使用display命令,每当程序在断点处停下,都会打印出跟踪的变量值。
(gdb) display info display查看已跟踪的变量,delete display取消跟踪显示变量。
step 执行一行代码
执行一行代码,如果改行代码是函数,将进入函数内部。
(gdb) sfinish 跳出函数
如果通过s单步调试进入到函数内部,想要跳出这个函数体,可以执行 finish命令。如果想要跳出函数体必须要保证函数体内不能有有效断点,否则无法跳出。
next 执行一行代码
next 命令和 step 命令功能是相似的,只是在使用 next 调试程序的时候不会进入到函数体内部,next 可以缩写为 n。
until 跳出循环体
通过 until 命令可以直接跳出某个循环体,这样就能提高调试效率了。如果想直接从循环体中跳出,必须要保证,要跳出的循环体内部不能有有效的断点,必须要在循环体的开始 / 结束行执行该命令。
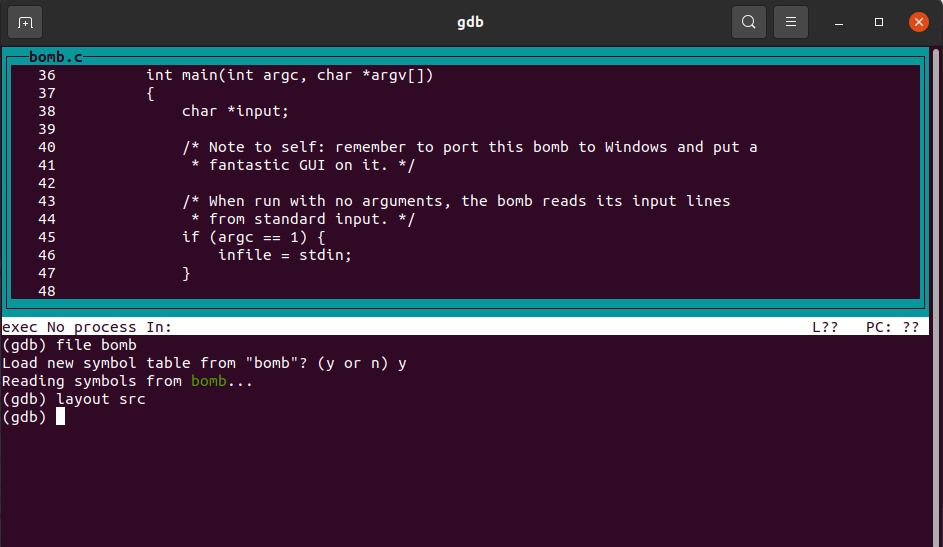
layout 分割窗口,边调试边看源码
layout src
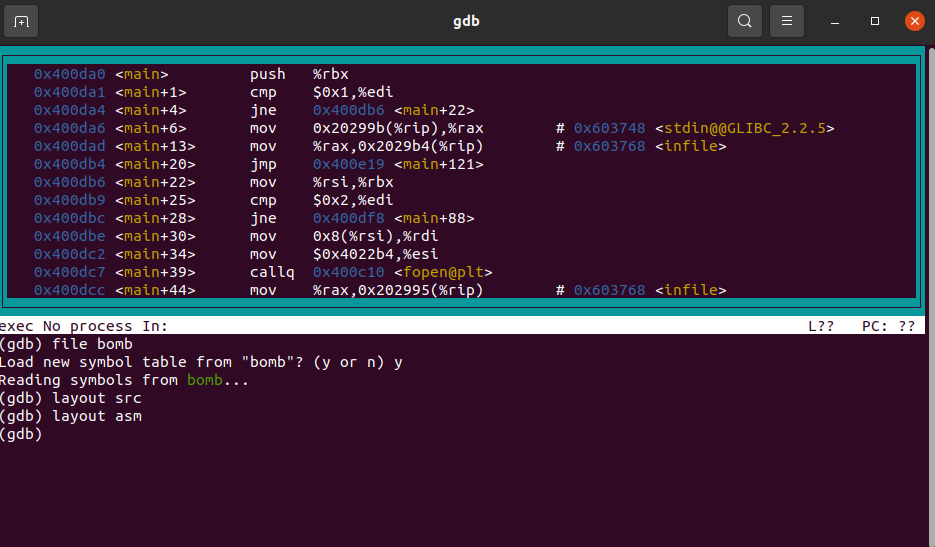
layout asm
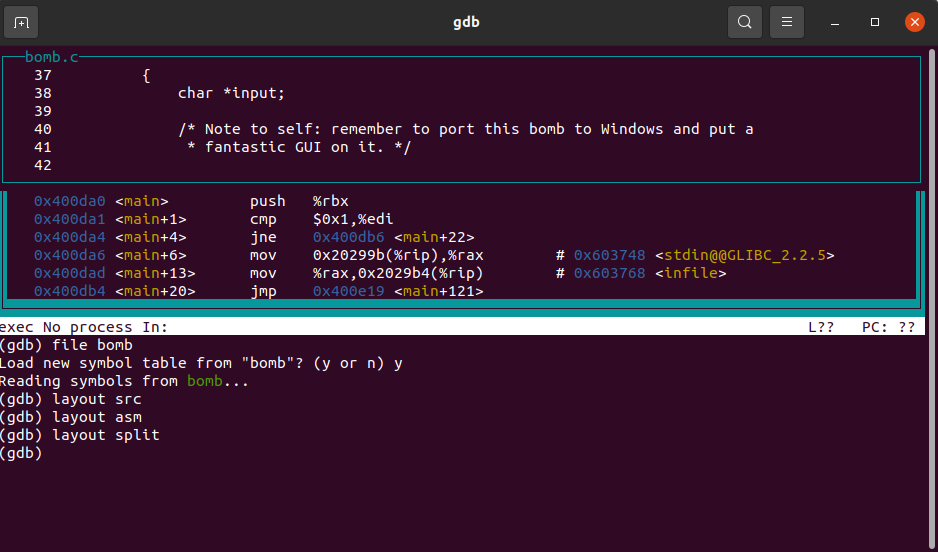
layout split
远程调试
-s -S
-s启动gdb server,默认端口号为 1234-S让程序在_start处停下。